

Total cost of risk, or TCOR, is the sum of everything an organization spends because of risk: insurance premiums, claims, deductibles, lost productivity, legal exposure, and administrative overhead combined into a single number. Managers who track it stop treating premiums as their only risk cost and start making retention, prevention, and budgeting decisions based on the full financial picture. The sections below walk through the formula, common measurement mistakes, and the practical steps that lower it.
TL;DR:
- Missing indirect costs, such as lost productivity and reputational damage, can cause underestimation of TCOR by more than double the actual claims cost.
- Benchmarking a retailer’s TCOR against broad industry averages can be misleading; peer group comparison by business type and local data yields more accurate risk insights.
- Regularly tracking TCOR as a trend instead of a single snapshot helps identify control failures or cost creep before premium increases occur.
- A structured self-assessment with local data reduces the time to generate reliable exposure estimates and improves risk management decisions for independent retailers.
Table of Contents
- What are the components of total cost of risk?
- How do you calculate total cost of risk?
- What mistakes distort total cost of risk numbers?
- How does TCOR drive retention, transfer, and budgeting decisions?
- Should you track TCOR with spreadsheets or a dedicated system?
- What can managers do now to reduce TCOR?
- How do documented risk assessments feed a retailer's TCOR?
- How much does TCOR vary by industry?
- How do regulatory changes affect total cost of risk?
- How are cybersecurity and climate risk reshaping TCOR?
- How does TCOR connect to enterprise risk management?
- What do real TCOR implementations teach us?
- Sustaining TCOR discipline inside your organization
- A faster path to TCOR-ready documentation for retailers
- Sources
What are the components of total cost of risk?
TCOR is built from several cost buckets, and missing even one skews the total enough to distort a budgeting decision. The standard breakdown treats risk financing, retained losses, administrative overhead, and taxes or fees as distinct line items that get added together, not netted against each other.
- Risk financing: insurance premiums, broker or agent fees, captive contributions, and letters of credit posted to secure deductibles.
- Direct loss costs: paid claims, retained deductibles, and loss adjustment expenses (LAE) tied to handling and settling those claims.
- Indirect loss costs: business interruption, lost productivity during recovery, overtime to cover gaps, and reputational or legal readiness costs after an incident.
- Administrative and third-party costs: internal risk management staff time, outside legal counsel, consultants, and safety program administration.
- Taxes and fees: state assessments, surplus lines taxes, and regulatory filing fees tied to insurance placement.
Indirect losses are the component most industry sources describe as consistently undercounted, largely because they rarely show up on an invoice the way a premium or a claim payment does.
How do you calculate total cost of risk?
The standard TCOR formula adds four buckets together: insurance premiums plus retained losses (paid and reserved) plus administrative costs plus indirect costs, usually expressed per $1,000 of revenue or per unit of exposure for comparability across locations.
- Add insurance costs. Say a mid-size retailer pays a substantial amount in annual premiums across property, general liability, and workers' compensation.
- Add retained losses. Paid claims and reserves for the year include a deductible on a slip-and-fall claim and other costs.
- Add administrative costs. Internal risk management time, broker fees, and claims administration incur significant costs.
- Add indirect costs. Lost manager hours, temporary staffing to cover an injured employee, and legal consultations add notable indirect costs.
- Sum and allocate. Total TCOR sums to a considerable figure. Divided across five store locations, it presents a per-unit cost relevant for budgeting, based on the chain's revenue.
Most organizations annualize TCOR and report it quarterly, prorating multi-year claims by the portion incurred in the current period rather than dumping the full reserve into one quarter.
What mistakes distort total cost of risk numbers?
The single biggest distortion is leaving indirect costs out entirely, since claims and premiums are easy to pull from an invoice while lost productivity, overtime, and reputational damage require estimation. A warehouse injury might generate a $12,000 claim and a $40,000 hidden cost in retraining, overtime, and delayed shipments that never appears in the claims report.
- Inconsistent definitions across business units, where one location counts deductibles as "direct" and another buries them in "administrative," break cross-location benchmarking.
- Relying on claims data alone ignores near-misses and unreported incidents that predict future losses.
- Attributing shared costs (a corporate safety officer's salary, say) to the wrong cost center inflates one unit's TCOR and deflates another's.
- Using inconsistent time periods, like comparing a calendar-year unit against a fiscal-year unit, makes trend lines meaningless.
Pro Tip: Pull one recent incident report and trace every dollar it touched, including overtime, temp staffing, and the hours your manager spent on paperwork. If that number is more than double the claim payment, your indirect costs are being undercounted organization-wide.
How does TCOR drive retention, transfer, and budgeting decisions?
TCOR gives managers a breakeven tool for deciding how much risk to retain versus transfer. If raising a deductible from $10,000 to $25,000 saves $30,000 in annual premium but historical claims data shows losses in that band average $18,000 a year, retaining the risk wins. Origami Risk's analysis frames this as moving past premium-only thinking toward a full-exposure view that treats financing and prevention spend as interchangeable levers.
- Track TCOR as a trend line, not a snapshot. A 5% year-over-year increase driven by indirect costs signals a control problem, not a market pricing issue.
- Rank loss-control projects by expected TCOR reduction per dollar invested, the same way you would rank capital projects by ROI.
- Use per-unit TCOR to benchmark stores, plants, or regions against each other, which surfaces underperforming locations faster than claims counts alone.
- Report TCOR to finance and the board as a percentage of revenue, since that framing translates risk into the same language used for every other budget line.
This is also where TCOR earns its place in enterprise risk conversations. It converts a scattered set of insurance renewals and incident reports into one number finance leaders can actually act on.
Should you track TCOR with spreadsheets or a dedicated system?
Spreadsheets work fine for a single location with a handful of claims a year, but they create version-control errors and break down once you need trend analysis across multiple business units. A risk management information system (RMIS) centralizes claims, exposure, and financial data so the same numbers feed every report automatically.
The minimum data set for a working TCOR program includes claims history, payroll or time-loss data, business interruption metrics, and third-party cost records. That's usually enough to unlock most retention and budgeting decisions without a full analytics build-out.
- Migrate to a RMIS once you're managing more than three or four locations, or once cross-unit comparisons matter for budgeting.
- Reconcile claims and financial data monthly, review TCOR trends quarterly, and present the full picture to leadership annually.
- Flag any month where indirect cost estimates haven't been updated. Stale estimates are the most common reason a TCOR trend line goes flat when reality hasn't.
What can managers do now to reduce TCOR?
Cutting TCOR doesn't require a new department. It requires sequencing the right fixes.
- Fix process gaps first. Retrain staff on the top three loss drivers from last year's claims, and tighten incident reporting so near-misses get logged before they become claims.
- Target loss control spend. Invest in the specific control (better lighting, updated cash handling, a locked storage protocol) tied to your highest-frequency claim type rather than a generic safety refresh.
- Negotiate contracts with data in hand. Bring your loss run and TCOR trend to your broker renewal conversation instead of accepting the market rate.
- Invest in analytics once basics are solid. A RMIS or a structured assessment tool pays for itself once you're tracking more than a handful of locations.
Pro Tip: Quantify expected savings before you pitch a project. "This lighting upgrade should cut slip-and-fall claims by an amount consistent with last year's frequency" is a business case; "this will improve safety" is not.
How do documented risk assessments feed a retailer's TCOR?
A structured self-assessment gives independent retailers something claims data alone can't: a documented, dollar-denominated view of exposures that haven't turned into losses yet. An annualized exposure report puts a number on vulnerabilities like inadequate cash-handling controls or missing incident documentation, which map directly into the indirect and administrative cost buckets in a TCOR calculation.
- Annualized exposure figures slot into the indirect loss column, giving finance a defensible estimate instead of a guess.
- Remediation cost estimates help managers rank fixes by expected TCOR reduction, the same logic used for any loss-control project.
- A defense file reduces administrative cost during a claim or legal dispute by cutting the hours spent reconstructing what controls were in place.
Retailers can use a tool like the retail loss prevention audit guide to map operational vulnerabilities directly into these categories before their next insurance renewal.
How much does TCOR vary by industry?
TCOR as a percentage of revenue swings widely by sector, driven mostly by claim frequency, severity, and how exposed the business is to third-party liability. A professional services firm with low physical exposure and modest payroll-based workers' compensation costs might run well under 1% of revenue. A retailer with high foot traffic, cash handling, and liquor liability exposure typically runs higher, since slip-and-fall claims, theft, and premises liability all stack on top of standard property and workers' compensation costs.
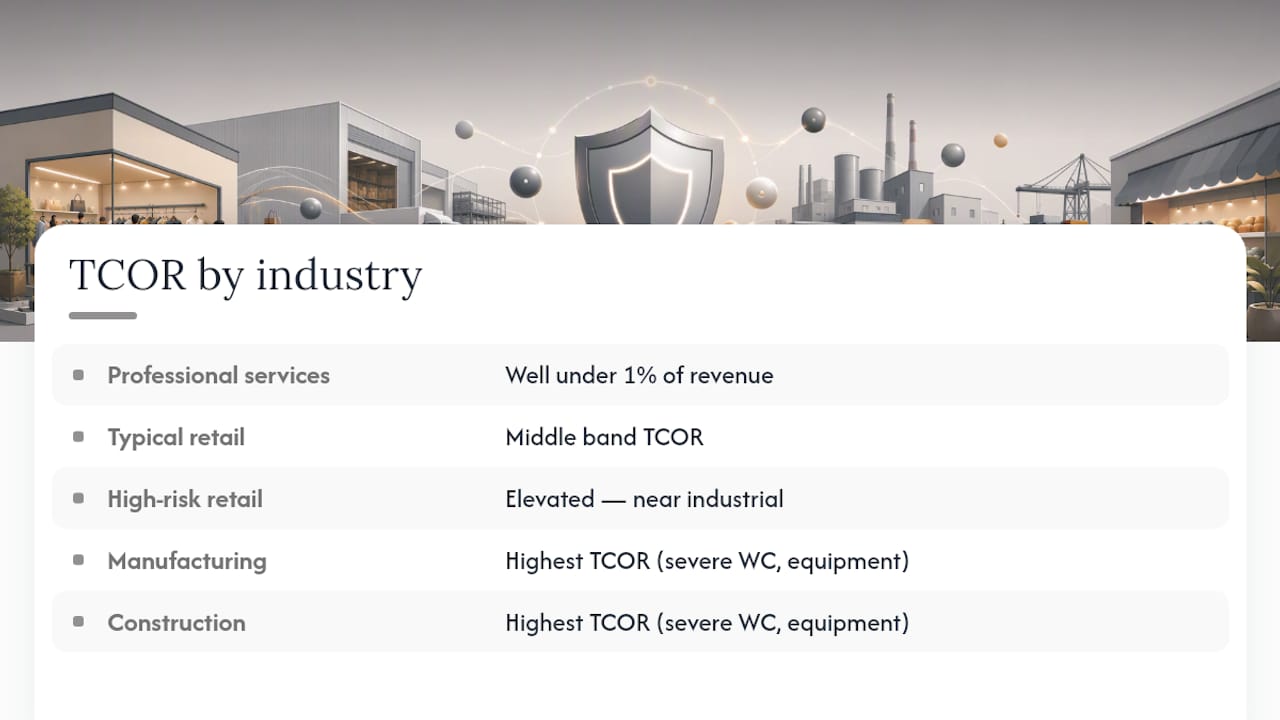
Manufacturing and construction sectors tend to carry the highest TCOR relative to revenue because of workers' compensation severity and equipment-related liability. Retail sits in a middle band, but certain retail subcategories, liquor stores, smoke shops, and convenience stores among them, carry elevated liability and crime exposure that pushes their TCOR closer to industrial benchmarks than a typical soft-goods retailer.
The variation matters because a generic industry average is close to useless for a specific business. A convenience store owner comparing their TCOR to a broad "retail" benchmark misses the crime and liquor liability factors that actually drive their number. Benchmarking works best within a tight peer group defined by business type, location, and exposure profile, not a broad NAICS code. Colorado-specific crime data, for instance, tells a liquor store operator far more about their realistic exposure than a national retail average ever could, since local theft and violent crime rates directly shape both claim frequency and premium pricing.
Managers who benchmark against too broad a category tend to either underinvest in controls (because their number looks fine against the average) or overspend on generic safety programs that don't address their actual risk profile. Getting the peer group right is the first step, not an afterthought.
How do regulatory changes affect total cost of risk?
Compliance costs sit inside TCOR whether or not a company labels them separately, and regulatory shifts tend to hit the administrative and indirect cost buckets hardest. New reporting requirements, updated OSHA standards, or state-level changes to liquor licensing and age-verification rules all add administrative hours and, often, new liability exposure if compliance lags.
For independent retailers, state and local regulatory environments shift more frequently than federal ones, and each change carries a documentation burden. A new age-verification requirement for tobacco or alcohol sales, for example, doesn't just require a policy update. It requires proof that staff were trained, that the policy was enforced, and that violations were addressed, all of which become part of the administrative cost line and, if documentation is missing, the indirect legal exposure line when a violation triggers a fine or a liquor board hearing.
Compliance costs also show up in risk financing. Insurers increasingly ask for documented compliance programs before offering favorable terms on liability coverage, particularly in categories with elevated regulatory scrutiny like alcohol and tobacco retail. A business that can produce clean compliance records at renewal time often negotiates better terms than one that can't, which means compliance documentation isn't just a legal safeguard. It's a lever on the risk financing component of TCOR.
The trend line points toward more documentation requirements, not fewer, across most regulated retail categories. Building a repeatable compliance-recordkeeping habit now costs less than reconstructing records under pressure during an audit or a claim dispute later.
How are cybersecurity and climate risk reshaping TCOR?
Emerging risk categories are pushing TCOR calculations into territory that traditional property and casualty coverage never anticipated. Cybersecurity incidents, point-of-sale breaches, ransomware, and payment data theft in particular, generate costs that span nearly every TCOR bucket at once: direct remediation, legal notification requirements, third-party liability to affected customers, and reputational damage that's genuinely difficult to quantify but very real.
Quantitative risk assessment methods can model these scenarios, but they demand reliable data and real expert effort, and the overhead of doing that rigor well can outweigh the benefit for a smaller retailer without a dedicated risk analytics function. For most independent operators, a simpler scenario-based approach captures the essential exposure without the overhead of a full quantitative model. Federal risk assessment methodologies, including tools like HAZUS, use exactly this kind of scenario translation to convert a hazard into an operational recovery timeline and a dollar figure, and the same logic scales down to a single retail location assessing what a breach or a covered-loss event would actually cost in downtime and remediation.
Climate-related exposure shows up differently depending on geography and building type: extreme weather events, water damage, and supply chain disruption from regional events all add to the indirect loss column even when a location itself isn't directly damaged. A retailer that loses a week of deliveries because a supplier's region floods carries a real TCOR hit with no insurance claim attached to it at all.
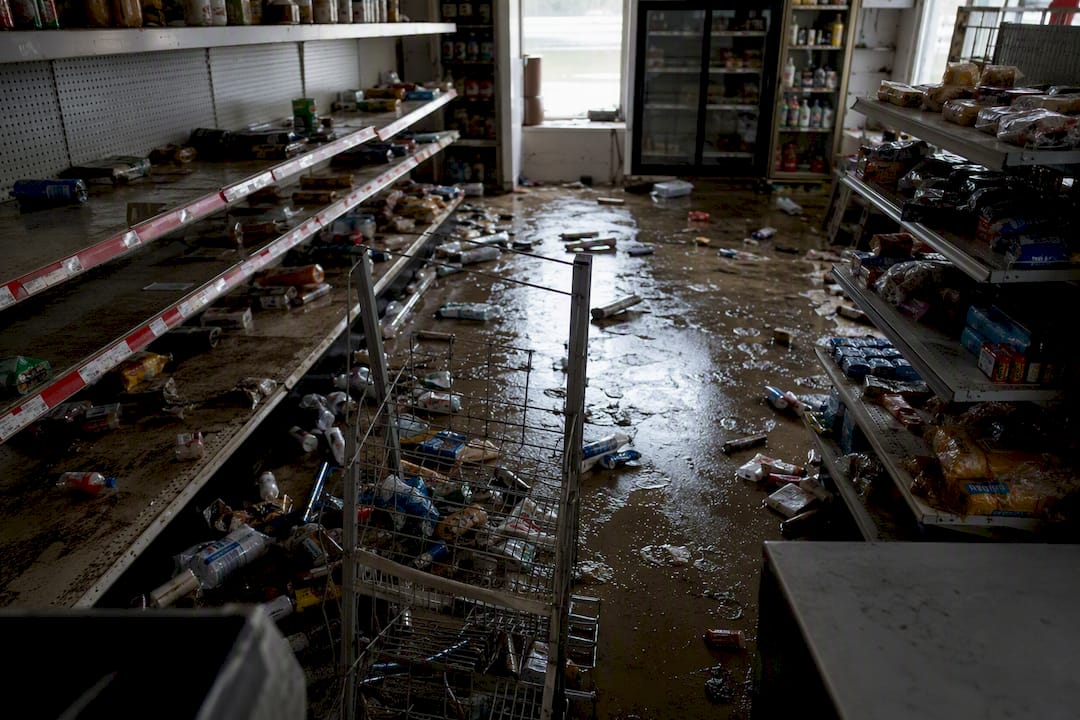
Both categories share a measurement challenge: the losses are infrequent but severe, which makes historical claims data a poor predictor. Scenario planning, estimating what a plausible worst case would cost rather than waiting for it to happen, fills that gap better than a spreadsheet built entirely from past incidents.
How does TCOR connect to enterprise risk management?
TCOR works best as an input to enterprise risk management (ERM), not a standalone metric sitting in the risk department. ERM asks which risks threaten strategic objectives and how much capital to hold against them; TCOR supplies the cost data that makes those judgments concrete instead of qualitative.
The connection runs both directions. ERM frameworks help prioritize which exposures deserve a full quantitative TCOR breakdown versus a simpler estimate, since not every risk justifies the data-collection overhead of rigorous quantification. A single-location retailer doesn't need the same modeling depth as a multi-state chain, but both need the same basic discipline: know your cost drivers, track them consistently, and revisit the numbers on a schedule.
Financial planning benefits directly once TCOR is treated as a recurring input rather than a once-a-year renewal exercise. Budgeting cycles that incorporate TCOR trends catch cost creep before it shows up as a painful premium increase at renewal. Cost management guidance from major consultancies makes a related point worth borrowing here: treat spending on differentiated, high-value protections as an investment to reallocate toward, not just a cost to cut. TCOR data tells you which protections are actually differentiated, meaning which controls are doing real work reducing losses, versus which ones are legacy spend with little measurable return.
For an independent retailer, this integration doesn't require a dedicated ERM function. It requires treating the annual insurance renewal, the monthly incident review, and the budget planning meeting as three views into the same underlying number, rather than three separate conversations that never reference each other.
What do real TCOR implementations teach us?
The organizations that get the most value from TCOR tend to share one habit: they treat the first year of measurement as a baseline-building exercise, not a finished analysis. A multi-location retailer that starts tracking TCOR often finds its first-year number is dominated by whatever large claim happened to hit that period, which is exactly why a single year's TCOR is a weak signal and a three-to-five-year trend is a strong one.
A common lesson from organizations that formalize TCOR tracking is that the exercise itself surfaces gaps nobody had flagged before. Pulling payroll data, time-loss records, and claims history into one place routinely reveals that one location has been quietly absorbing far more indirect cost, unreported near-misses, informal overtime coverage, ad hoc repairs, than anyone realized, simply because nobody had put a number on it before.
The organizations that struggle with TCOR implementation almost always share the same root cause: they tried to build a comprehensive quantitative model before they had reliable basic data. Structured methodologies bring real rigor, but rigor applied to bad inputs just produces a precise-looking wrong number. The more durable pattern starts small, claims, payroll impact, and one repeatable way to estimate indirect losses, then adds sophistication once that foundation holds up across a few reporting cycles.
For independent retailers specifically, the lesson translates into something concrete: a documented self-assessment that quantifies exposure before an incident happens gives you a head start most competitors don't have when they're building their first TCOR baseline from scratch after a loss already occurred.
Sustaining TCOR discipline inside your organization
TCOR only stays useful if someone owns it, usually risk management or finance, with operations feeding real incident and productivity data every cycle. The two functions need a shared number they both trust, updated on the same schedule, or the metric quietly drifts into two competing versions. Treat TCOR as a living number you revisit quarterly, not an annual renewal artifact you file away.
— Fonz
A faster path to TCOR-ready documentation for retailers
Building the indirect cost inputs for TCOR from scratch, incident logs, exposure estimates, remediation cost projections, takes most independent retailers weeks they don't have. Onebridgesecurity closes that gap with a free self-assessment built specifically for independent Colorado retailers, including liquor stores, smoke shops, and convenience stores, that generates results in 12 minutes instead of weeks of manual documentation work.
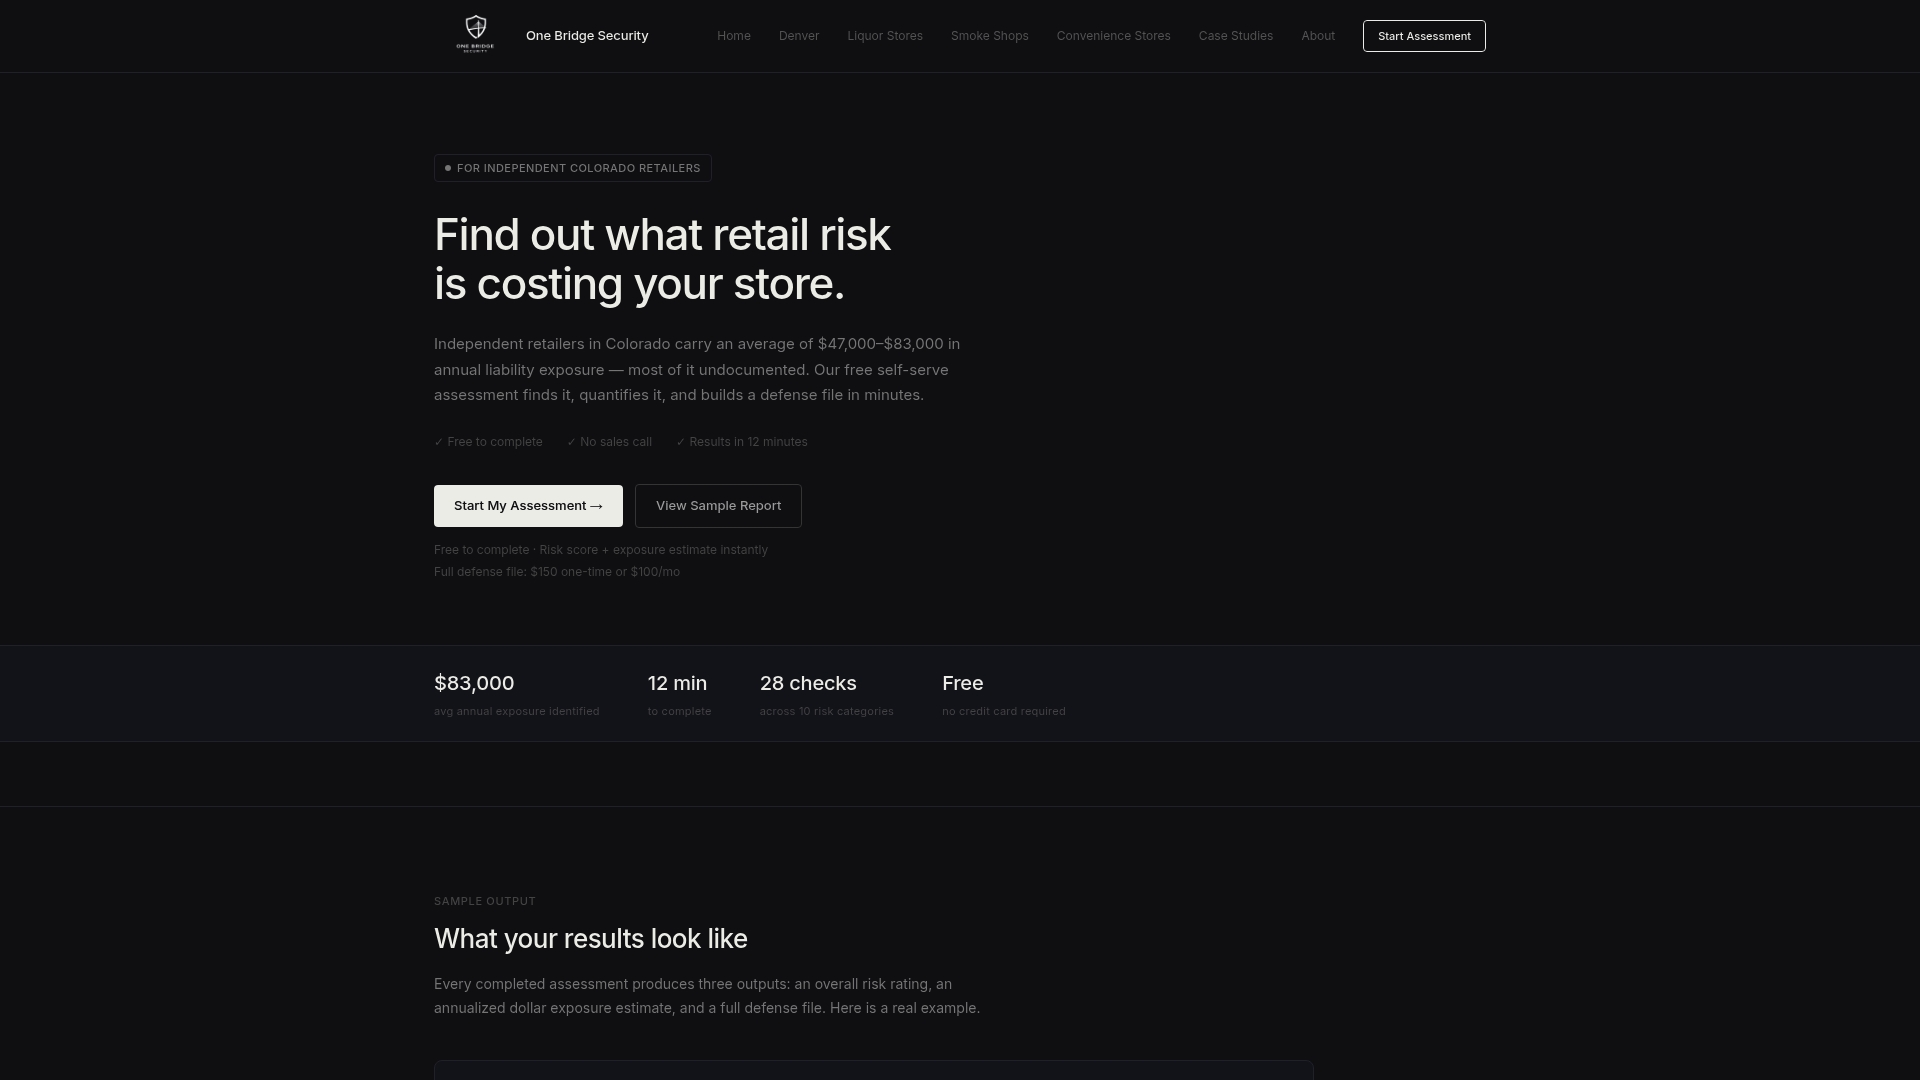
The output includes an annualized dollar exposure report that slots directly into the indirect and administrative cost lines of a TCOR calculation, plus a comprehensive defense file designed to hold up during insurance claims, landlord disputes, or legal discussions. Rather than another generic security checklist, it uses Colorado-specific crime data and category-specific vulnerability scoring to quantify what your operational gaps actually cost. You can see exactly what that looks like in the sample risk assessment report, or start the free retail risk assessment directly and have your own exposure figures before your next insurance renewal.
Sources
- Total Cost of Risk (TCOR) - Defined and Calculated
- Understanding Total Cost of Risk (TCOR) and Its Strategic Importance
- NIST Special Publication 800-30 Revision 1
- Risk assessment methodologies — CISA resources