

Annualized loss expectancy (ALE) is the expected dollar loss per year from a specific risk, calculated as ALE = SLE × ARO. Single loss expectancy (SLE) is what one incident costs; annual rate of occurrence (ARO) is how often it happens each year. Multiply them, and you get a defensible number for budgeting, insurance conversations, and prioritizing which risks actually deserve money.
TL;DR:
- The asset value used in ALE calculations should encompass replacement costs, lost revenue, legal fees, and remediation expenses to accurately reflect potential losses.
- Frequent risks like shoplifting may have a higher ALE than rare events such as ransomware because the cumulative cost from regular incidents can outweigh one-time catastrophic losses.
- Estimating ARO involves careful analysis or industry data, and uncertain inputs should be modeled as ranges to account for data limitations and avoid false certainty.
- Documenting the inputs behind ALE figures, including asset value, exposure factor, and frequency estimates, strengthens insurance claims and risk management credibility.
- Use ALE primarily for recurring risks and supplement with probabilistic models like Monte Carlo simulations for low-frequency, high-severity threats such as natural disasters or major cyberattacks.
Table of Contents
- What Does Annualized Loss Expectancy Measure?
- How Do You Calculate ALE Step by Step?
- How Do You Use ALE for Budgeting and Executive Reporting?
- Where Does ALE Fall Short?
- What Should You Check Before Trusting Your ALE Numbers?
- Why ALE Matters More When It's Documented, Not Just Calculated
- Turn Your ALE Estimate Into an Insurer-Ready Number
- Sources
What Does Annualized Loss Expectancy Measure?
ALE turns a vague worry, like "our store might get robbed," into a specific dollar figure a CFO can act on. The formula breaks into two pieces, and getting each one right determines whether your final number means anything.
Single Loss Expectancy (SLE) is the cost of one occurrence, and it's built from two inputs: SLE = Asset Value (AV) × Exposure Factor (EF), per the NIST Cybersecurity Framework glossary.
- Asset Value (AV) is what's at stake: replacement cost, lost revenue during downtime, remediation labor, legal fees, and regulatory fines.
- Exposure Factor (EF) is the percentage of that asset value lost in a single event, ranging from 0% to 100%. A phishing incident that locks you out of email for a day might carry an EF of 10%. A full point-of-sale system compromise could hit 60% or higher.
- A $100,000 asset with a 40% exposure factor produces an SLE of $40,000, straight from NIST's own worked example.
Annual Rate of Occurrence (ARO) is how often the event happens per year, and it doesn't have to be a whole number. An ARO of 0.1 means once every ten years; an ARO of 3 means three times a year. NIST notes ARO gets estimated from historical incident logs, industry benchmarks, or informed judgment when data runs thin.
How Do You Calculate ALE Step by Step?
The math itself takes seconds. The work is in gathering honest numbers for each input. Here's the sequence:
- Identify the risk event. Be specific: "shoplifting of high-value liquor" is calculable; "theft" is not.
- Calculate Asset Value (AV). Add replacement cost, lost margin during any downtime, remediation labor, and legal or notification costs.
- Estimate Exposure Factor (EF). What percentage of that asset value does one incident realistically wipe out?
- Estimate Annual Rate of Occurrence (ARO). Pull from your own incident history, local crime data, or industry loss reports.
- Compute SLE, then ALE. Multiply AV × EF for SLE, then SLE × ARO for the final annualized figure.
CalcoI's calculator walkthrough demonstrates this five-step sequence clearly, and it's worth running your own numbers through a similar tool before presenting them to anyone with budget authority.
Three examples show how differently this plays out depending on frequency versus severity.
Notice that the shoplifting scenario, cheap per incident, produces a higher ALE than the phishing breach because it happens constantly. Vcso makes this exact point: frequency can outweigh severity when you're deciding where security dollars go. A rare catastrophic event feels scarier, but a nagging, repeated loss often drains more money over twelve months.
How Do You Use ALE for Budgeting and Executive Reporting?
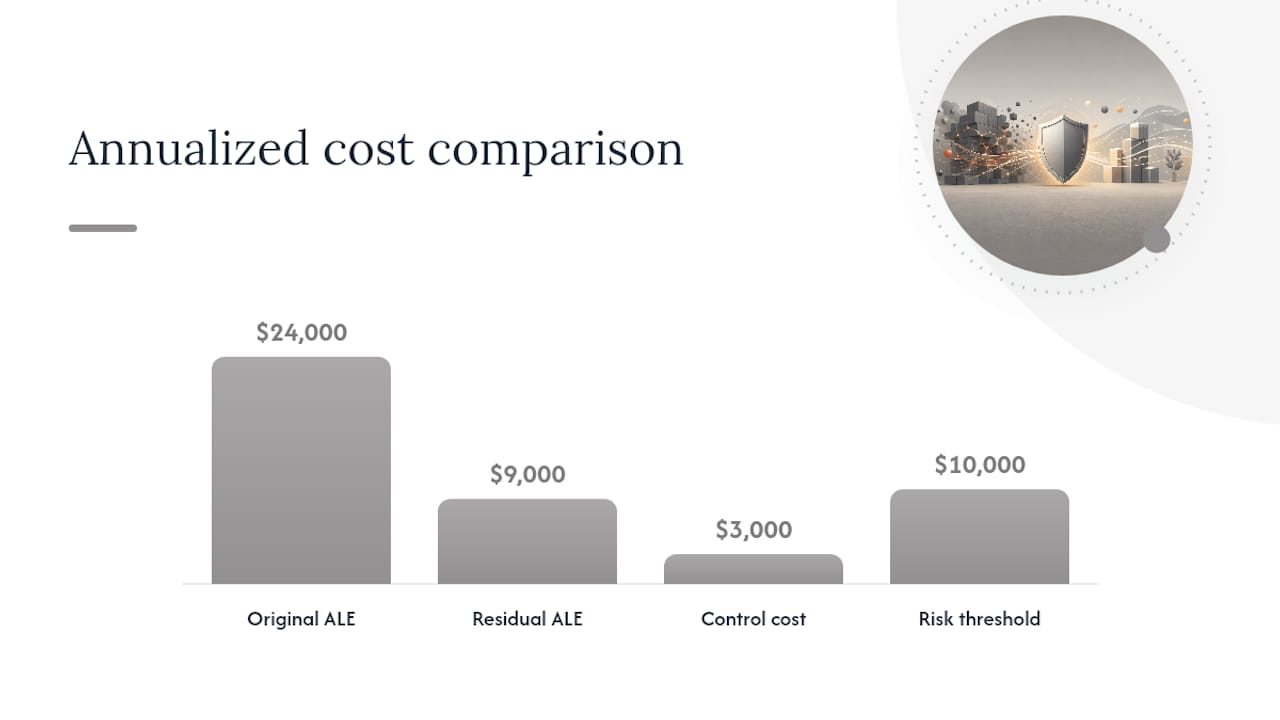
ALE earns its keep the moment you compare it against the cost of a fix. If an ALE for account compromise drops significantly after adding multifactor authentication that costs a moderate annual amount, that control can pay for itself multiple times over. That comparison, residual ALE versus control cost, is exactly what CalcoI's calculator is built to model.
For leadership conversations, keep it to one line: "This risk costs us an expected $24,000 a year; this control drops it to $9,000 for a $3,000 investment." Back it with a short table, not a slide deck.
- Rank risks by ALE, highest first, when deciding where to spend.
- Set a risk threshold (say, any ALE over $10,000 needs a documented control plan).
- Feed ALE figures into your broader key risk indicator (KRI) and enterprise risk management reporting rather than treating it as a standalone metric, a point Baker Tilly's ERM guidance makes directly.
- Recalculate ALE after every major control change to show trend lines over time.
Pro Tip: Present ALE as a range, not a single number, when you're in front of a board. "$18,000 to $30,000 annually" survives scrutiny better than a suspiciously precise "$24,000" that invites someone to ask how you got so exact.
Where Does ALE Fall Short?
ALE is a long-run average. It tells you what a risk costs on average over many years, which makes it a poor tool for rare, catastrophic events, a ransomware attack that only strikes once but could bankrupt the business doesn't behave like a repeatable statistical average.
NIST's own guidance on estimating risk inputs flags this directly, noting that sparse historical data makes ARO estimates shaky, and recommends running sensitivity analysis across plausible ranges rather than trusting one point estimate.
- Use ALE for frequent, well-documented risks: shoplifting, minor fraud, routine equipment failure.
- Switch to scenario planning or a probabilistic model like Monte Carlo simulation or the FAIR (Factor Analysis of Information Risk) framework for low-frequency, high-severity events, ransomware, natural disasters, catastrophic data breaches.
- Build a hybrid workflow: run ALE for your everyday operational risks, and layer scenario modeling on top for the tail risks that could actually end the business.
What Should You Check Before Trusting Your ALE Numbers?
Bad inputs produce a confident-looking number that's wrong. Before you present any ALE figure, run through this:
- Confirm asset value includes replacement cost, lost revenue, remediation labor, and legal or notification costs, not just the sticker price of what was stolen.
- Write down your EF assumptions in plain language so someone else can challenge them later.
- Lean conservative on ARO when your incident history is thin. Guessing high on frequency is safer than guessing low.
- Never double-count the same loss across two different risk categories.
NIST's sensitivity analysis guidance suggests testing ARO across a range, say 0.1 to 1.0, and reporting ALE as a band rather than a single figure. That range communicates honesty about uncertainty instead of false precision.
Why ALE Matters More When It's Documented, Not Just Calculated

Retailers rarely lose insurance disputes because their risk was too high. They lose them because nobody wrote the numbers down before the incident happened. When an insurer or landlord asks "what was your exposure to this risk," a documented ALE figure, backed by real inventory values, exposure assumptions, and local incident frequency, carries far more weight than a verbal estimate offered after the fact.
A defense file that shows the AV, EF, and ARO behind a number holds up in claims discussions in a way that hindsight never does. That's the entire premise behind treating ALE inputs as retail documentation, not just a spreadsheet exercise.
— Fonz
Turn Your ALE Estimate Into an Insurer-Ready Number
Running the ALE formula by hand gets you close. Getting a number an insurer or landlord will actually trust takes documented inputs, not guesses at asset value or exposure factor. Onebridgesecurity's free self-assessment does that legwork for independent Colorado retailers: it pulls Colorado-specific crime data for your ARO estimate, scores your vulnerabilities to inform exposure factor, and generates an annualized dollar exposure report in about 12 minutes, no sales call required.
That output maps directly to the AV, EF, and ARO inputs covered above, so the number you get isn't a rough guess, it's a documented figure built the same way this article walked through, minus the manual work. Retailers who want the deeper version can see what a completed sample risk assessment report looks like before committing to anything. If you run a liquor store, smoke shop, or convenience store and want an annualized exposure figure you can actually hand to an insurer, start the free assessment today.